

A Gap Analysis of Perception and Expectations of Patients for the Nursing Service in a Tertiary Hospital in the Maldives
Mariyam Nashrath, RN, MNS
ABSTRACT
Nursing service is an important component of healthcare service, thus improving nursing service quality is a primary objective of the healthcare system. The purpose of this research was to investigate patients’ perception of nursing service quality by measuring patients’ expectation from nursing service and perception of actual service provided and to identify areas of nursing services that need improvement. The instrument used in the study was SERVQUAL scale. Subjects included were 282 patients from nine wards of a tertiary care hospital in the Maldives. The response rate was 70.5%. Descriptive statistics and t test were used to analyze subjects’ response. Result of the study indicated patients’ perception of performance of nursing service quality was lower than patients’ expectation from nursing service quality. Gap score for each dimension of nursing service shown that the four dimensions had negative gaps, the largest gap was -1.11 for Assurance, followed by -1.01 for Tangibility, -0.58 for Reliability and -0.11 for Empathy. In contrast, Responsiveness dimension has shown positive gap 0.79 which indicate patients expectation was met as patients’ perception of nurses’ performance for this dimension was higher than patients’ expectation. The results of this study findings could provide nurses information about aspects of nursing service that can promote patients perception of quality nursing service.
Key words: Service quality, nursing, nursing service, patient perception, patient expectation, SERVQUAL
INTRODUCTION
Transformation in health care systems across the globe has been result of the focus on quality of health services which involves provision of effective, safe, person-centered care that is timely, equitable, integrated and efficient (WHO, 2018). Optimum health services cannot be offered simply by ensuring existence of infrastructure, medical supplies, equipment, range of services and health care providers. Targeting the needs of patients and addressing to their preferences have become important factor which contribute towards improving health service delivery, enhancing patient satisfaction and achieving better clinical outcomes (Hijazi, et al., 2018).
In healthcare settings, person-centered approach can be adopted by meeting the patients’ needs, involving them in planning, developing and evaluating care (Hijazi, et al., 2018). This requires involving patients in decision making and working along with health care providers in determining what matters to them and how to improve their health service delivery. Patients need to be engaged in design, delivery and ongoing assessment of health services to ensure they meet the health needs of them. Offering care in a patient-centered way can contribute to satisfied and loyal patients, improved care delivery and better clinical outcomes (Santana, et al., 2017).
In health care organizations, patients are health care consumers similar to consumers of other service sectors and likewise patients perceive about service quality after they encounter with the services and their perception is influenced by their service experiences (Hiidenhovi, Nojonen, & Laippala, 2002). Increasing attention has been paid for consumers/patients in the health care organizations as they are the sole reasons for the existence of such organizations (Patwardhan & Patwardan, 2009). In the consumerism paradigm, which is commonly appearing in the health care organizations agenda, emphasis is on service quality and consumer satisfaction; however it remains as a critical issue for health care providers (Choi K. , Cho, Lee, Lee, & Kim, 2004). This may be due to health care services being unique from other services as from the nature of the service and being highly involved in risks to the consumers (Rashid & Jusoff, 2009). However, hospitals and health service providers need to establish close links with their consumers, strive to meet the needs and expectations of consumers to gain their satisfaction and confidence about services which are being provided.
Although patients do come in contact with various levels of health personnel when seeking services, the most common interaction occurs between patients and nurses. During hospitalization, patients contact nurses more than other health care personnel as nurses’ accounts for largest health care workforce in hospitals (Brooten, Youngblut, Kutcher, & Bobo, 2004; Kunaviktikul, et al., 2001; Stone & Tourangeau, 2003). This leads nursing service to be considered as an important component of healthcare service, as it reflects patients overall satisfaction with the other services (Valentin, Lopez, & Garrido, 2005). Since nurses are largest work group and the core front-line healthcare providers, their input is fundamental in an organization’s success in delivering safe and quality services (Aiken, Sloane, Bruyneel, Van den Heede, & Sermeus, 2013).
Considering the important role of nurses in health service delivery process, it is essential to measure nursing service quality from patients’ point of view as nursing service is integral to the provision of quality services to the patients. Moreover, in the nursing service, inpatient services are significant area of their work as the nurses contact patients more frequently and on continual basis, nurses assess patient’s condition, identify problems and implement care to meet the patients’ needs. As such, this study intend to investigate patients perception of nursing service quality by measuring patients expectation from nursing service and perception of actual service performed and to identify areas of nursing service that need improvement.
LITERATURE REVIEW
Service Quality
Service quality is a widespread concept which is applied in various service sectors and the concept has been defined in various forms. Service quality can be defined as providing consumers something which is intangible that it gives them value and feeling of satisfaction (Brysland & Curry, 2001). Service is referred as intangible, as consumers cannot assess a service before they are purchased and to obtain services consumers buy performances rather than objects (Dalrymple & Parsons, 2000).
Service quality was conceptualized according to Parasuraman, Zeithaml and Berry (1985), as the result of consumer’s comparison of expected service with perception of actual performance of the service. Expectations are wants or desires of the consumers that they feel should be offered to them rather than what would be offer to them by service providers and the perception of performance is consumers’ evaluation regarding a service which is performed (Parasuraman, Zeithaml, & Berry, 1988).
Nursing Service Quality
Service quality studies which were conducted focusing on nursing service are not as extensive as studies on service quality of health care. Studies which focused on nursing service quality assessed patients and nurses perception of nursing service quality (Kim & Lee, 2004; Lee & Yom, 2007), examined nursing service quality of Scottish colposcopy clinic from patients perspective (Wisniewski & Wisniewski, 2005), used qualitative method to assess nursing service quality as expected by patients (Damapong, 2007). A study conducted among registered nurses working in Malaysian pubic hospitals have found empathy and reliability as two factors measurement model of nursing service quality (Mohamed, Mat, Salleh, & Yusof, 2016). Gap analysis between patients’ perceptions and expectations from nursing care was investigated among 432 medical-surgical patients in a public hospital in Saudi Arabia (Al-Momani, 2016). Additionally, a study determined extent of disconfirmation of perceived nursing service quality by patients and its relationship to patient satisfaction, intent to return and intent to recommend the service to others (Chou, Chen, Woodard, & Yen, 2005).
Studies have shown that perceived service quality have relationship with patients satisfaction (Lim & Tang, 2000; Andaleeb, 2001) and both service quality and consumer satisfaction have been found to be related to intention to revisit hospitals (Chou, Chen, Woodard, 2005; Lee & Yom, 2007). Service quality influences customers behavioral intentions as word of mouth referrals, stating about the defects in the service to others (Choi K., Cho, Lee, Lee, & Kim, 2004) and retaining customers can facilitate to gain profit (Lim & Tang, 2000). According to Lee and Yom (2007) measuring nursing service quality can enhance provision of nursing care, will identify changes that need to brought to hospital environment related to nursing service and can facilitate to identify differences in expectations and performance in both patients and nurses in order to reduce the gap of expectation and performance. Furthermore, measuring service quality enables service providers to benchmark services with their competitors and add value for their own service productivity (Padma, Rajendran, & Sai, 2009). However, failure in service provision can lead to consumers perceive the service as “bad service” (Padma, Rajendran, & Sai, 2009). If organizations respond to service failures it can restore customer satisfaction and reinforce loyalty thereby preventing customer defection and customers switching behavior to other similar service organizations (Smith, Bolton, & Wagner, 1999).
Expectations and Perceptions
Expectations and perceptions are widely used approach for the assessment of service quality focusing on attributes or dimensions related to various service sectors. One model of consumer satisfaction is the difference between perceived performance and customer expectations (Johnson, Nader, & Fornell, 1996). A qualitative study conducted in six hospitals located in Bangkok for identifying nursing service quality as expected by patients had shown that patients mostly expected to have calming, peaceful environment with privacy and modern medical equipment. In addition, the study results indicated that patients expected affection and warm welcome from nurses, nurses to have competence in their practice, to provide empathy and care, to provide health teaching, to have one stop service and nurses to comply with nursing ethics (Damapong, 2007). Researchers suggested, understanding people’s expectations as a key measure for assessing service quality (Papanikolaou & Zygiaris, 2012; Ishfag, Qadri, Abusaleem, & Al-Zyood, 2015).
In consumer model the assumption is consumers have expectation of service and that the degree to which expectations are fulfilled can be measured. When fulfillment is lower than expectation the greater gap and the lower satisfaction. When fulfillment is higher than expectation the greater the gap and the higher the satisfaction (Baron-Epel, Dushenat, & Friedman, 2001). Expectation is belief about a product that serve as standards against which product is judged (Zeithaml, Berry, & Parasuraman, 1993). On the other hand, perception refers to the consumers’ evaluation of the service (Parasuraman, Zeithaml, & Berry, 1985). Thus, expectations and perceptions play a role for consumers to be satisfied with service quality.
In health service institutes unless perceptions and expectation are measured it would be difficult to identify and prioritize improvements and to ensure patients’ needs and expectations are met. If health services is to be perceived as satisfactory, it need to take consideration for assessing patients’ expectations and perception of actual performance.
Measurement of Service Quality - SERVQUAL
Though several dimensions and models of service quality have evolved within health care setting, literature had shown that that conceptual model of service quality-the Gap Analysis Model developed by Parasuraman, Zeithaml, and Berry (1985) as the most widely applied model for assessing service quality of various aspects within health care. This service quality model incorporates five gaps. According to Parasuraman, Zeithaml, and Berry (1985) the gap 1 indicates differences between consumer expectation and management perception of consumer expectation. Gap 2, of the model demonstrates difference between management perception of consumer expectations and service quality specifications. The gap 3 indicates differences between service quality specification and service actually delivered. Gap 4 of the service quality model implies differences between service delivery and what is communicated about the service to consumers. The gap 5 of the model shows difference between consumer expectations and perception about service delivery. The gap 5 is known as the perceived service quality gap and it is linked with the four other gaps which are from the service providers’ side (Rashid & Jusoff, 2009).
According to Parasuraman, Zeithaml, and Berry (1985) perceived service quality can be assessed in service-providing organizations with the use of SERVQUAL scale which consists 22 pairs of questions comparing consumers expectations to their perceptions in five dimensions as follows:
- Tangibility: physical evidence of services such as physical facilities, equipment and adequate appearance of employees.
- Reliability: maintaining consistency of performance and ability to perform the service dependably and accurately.
- Responsiveness: willingness to provide services to customers by considering timeliness of services.
- Assurance: knowledge and courtesy of employees and their ability to convey trust and confidence to customers through competence, creditability and security.
- Empathy: provision of caring and individualized attention to customers by employees.
Since, nursing services are broad and multidimensional they can be categorized to fit into five dimensions provided in the SERVQUAL scale for ensuring nurses provide and patients receive quality nursing service. As such the tangible dimension can be applicable in nursing service quality to assess nurses’ appearance, physical facilities and equipment used for providing nursing service. Reliability dimension can be used to assess nurses’ ability to perform nursing service consistently, dependably and accurately. The responsiveness dimension can be applied to examine nurses’ willingness to provide prompt service and their attentiveness in dealing with patients’ related problems. Assurance dimension can facilitate to assess knowledge and courtesy displayed by nurses and their ability to inspire patients trust and confidence. Moreover, the empathy dimension can be used assess caring and individualized attention provided to patients by nurses.
In the SERVQUAL scale each item appears twice as it is separated to “expectation” part and to the “perception of performance” part. Thus, the scale is designed to assess expectation from the service as well as perception of service performance. A gap score for each statement is calculated as “perception of performance score minus expectation score”. Service quality is measured in this scale by calculating the difference between raw “perception of performance” score and the raw “expectation” score. According to Parasuraman, Zeithaml, and Berry (1988), SERVQUAL can be used to assess service quality of each of five service dimensions by averaging difference scores on items making up the dimension. Additionally, SERVQUAL can provide overall measure of service quality by averaging score across all the five service dimensions. Following these calculations when “perception of performance” is higher than the “expectation”, then SERVQUAL considers good service quality but if reverse occurs it indicates poor quality (Lee & Yom, 2007).
Over the past two decades numerous researchers examined various aspects of service quality and out of these researches SERVQUAL scale had been most commonly used scale for assessing service quality (Rashid & Jusoff, 2009; Ladhari, 2009; Padma, Rajendran & Sai, 2009). Some studies have found negative gaps for the 5 nursing service quality dimensions evaluated (Al-Momani, 2016), found statistically significant difference between nursing service quality as perceived by nurses and patients (Nashrath, Akkadechanunt, & Chontawan, 2011). A study aimed to measure gaps in the quality of healthcare insurance in Saudi Arabia using SERVQUAL model shown that generally consumers were satisfied with the all dimensions of service except for reliability (Ishfag, Qadri, Abusaleem, & Al-Zyood, 2015). SERVQUAL scale was used to evaluate quality disconfirmation of nursing service in Taiwan resulting responsiveness as was the highly significant in predicting overall satisfaction with hospital services (Chou, Chen, Woodard, & Yen, 2005). The Korean version of SERVQUAL scale was applied for examining nursing service quality (Lee & Yom, 2007); in the study overall nurses’ expectations and performance were higher than those of patients.
Ensuring quality of service can be a challenge in today’s changing health care environment. However, with emphasis on patient-centered care and patient provider relationship it is essential to implement ways to ensure that patients have their need and expectations met. To be able to meet patients expectations nurses need to know and understand patients’ expectations and perceptions about actual performance of nursing services as this can enhance provision of better services to patients. For this purpose this research will identify patients’ perception of nursing service quality by measuring patients’ expectation from nursing service and perception of actual service provided and identify areas of nursing services that need improvement.
METHODS
Study Setting and Design
A descriptive survey was conducted with patients admitted in 150 bed tertiary care hospital in the Maldives. This study was conducted between May 2018 and August 2018 within 9 inpatient wards.
Ethical Consideration
Permissionto conduct this study was obtained from the hospital Ethical Committee on Research. The procedure of the survey was explained to all participants and informed consent was obtained prior to collecting the data for the study. Instead of patients’ names, numerical codes were used in the questionnaire forms to maintain identity confidentiality and anonymity. All of the data obtained in this study were handled confidentially.
Participants
Convenience sample of 400 adult patients were selected proportionately from each ward based on the following inclusion criteria: patients who had minimum of 2 days of hospitalization, were able to read and write Maldivian language, age 18 years or older, in stable medical condition, not suffering from mental or cognitive disorders and patients consenting to participate in the study.
Data Collection and Instruments
Research instruments that were used in this study included demographic data and SERVQUAL scale. The SERVQUAL scale developed by Parasuraman, Zeithaml, and Berry (1988) was modiï¬ed by the researchers to fit with the nursing service context by using the term “nurse”, “patient” and “nursing service”. The modified SERVQUAL scale was validated by five experts and the content validity index for SERVQUAL scale was 0.82. After the validation process the SERVQUAL scale was translated to Maldivian language, back-translated into English, and then the original English and back-translated versions were tested for equivalence.
The modified questionnaire was piloted 20 patients who met the inclusion criteria of the study (not included in the study) was used to test for the reliability of the SERVQUAL scales. The Cronbach’s alpha coefficient was 0.88. Patients who participated in the study were requested to complete SERVQUAL scale – patients’ expectation from nursing service quality section on the day of admission and to complete patients’ perception of nurses’ performance of nursing service quality section after two days of stay in the hospital or prior to discharge if hospital stay was more than two days.
The SERVQUAL scale consisted of two sections, which were Section A and Section B. Section A was expectation from nursing service quality and, Section B was for perception of performance of nursing service quality. Each section of the scale consisted 22 items with five dimensions: Tangibility, Reliability, Responsiveness, Assurance and Empathy. A five-point Likert like scale was used for the scoring system, with (5) representing “strongly agree” and (1) representing “strongly disagree”. The Tangibility dimension consisted of four items, Reliability dimension consisted of five items, Responsiveness and Assurance dimensions included four items in each dimension and five items were included in Empathy dimension.
Data Analysis
The data were coded, entered to computer and analyzed using Statistical Package for Social Sciences (SPSS) version 23 (USA). Descriptive statistics were used to present demographic data of the patients who participated in the study. Descriptive analysis with mean and standard deviation were generated to present expectation from nursing service quality and perception of nursing service quality performance. The mean score of patients’ expectations and perceptions and the gap scores of the 22 items were calculated. The SERVQUAL score was computed as service quality (SQ) = performance score (P) – expectation score (E). The mean patient expectation and perception values for each dimension of nursing services were tested for differences between the mean scores of the sample at a level of significance of 0.05 using a t test.
RESULTS
A total of 400 eligible patients were selected and questionnaires were distributed, completed questionnaires were received from 282 patients (70.5%). The complete questionnaires were used for data analysis. Majority of patients (65.2%) were female and (38.2%) had secondary level education. Of the 282 participants, 65 (23%) were admitted to ward 4, and (65.6%) never had admission to this hospital before, which indicate this was their first time being hospitalized in this hospital. Most (n=282; 81.6%) of the patients had a length of stay in the hospital for 2 to 5 days (Table 1).
Table 1.Demographic characteristics of the respondents (n = 282)
Variables |
Frequency |
Percentage (%) |
|
Age (years) |
||
|
18 -25 |
68 | 24.1 |
|
26 - 35 |
132 |
46.8 |
|
36 - 45 |
47 | 16.7 |
|
46 - 55 |
17 | 6.0 |
|
56 - 65 |
12 | 4.3 |
|
More than 65 |
6 | 2.1 |
|
Gender |
||
|
Female |
184 | 65.2 |
| Male |
98 |
34.8 |
|
Ward |
||
|
NS 4 |
47 | 16.7 |
|
NS 5 |
17 | 6.0 |
|
NS 6 |
32 | 11.3 |
|
NS 7 |
35 | 12.4 |
|
Ward 3 |
17 | 6.0 |
|
Ward 4 |
65 | 23.0 |
|
Ward 6 |
18 | 6.4 |
|
Ward 7 |
29 | 10.3 |
|
Ward 8 |
22 | 7.8 |
|
Education Level |
||
|
Literate |
39 | 13.8 |
|
Primary School |
9 | 3.2 |
|
Secondary School |
108 | 38.3 |
|
Higher Secondary School |
32 | 11.3 |
|
Diploma |
46 | 16.3 |
|
Bachelors Degree |
32 | 11.3 |
|
Masters Degree |
16 | 5.7 |
|
Number of Previous Admissions |
||
|
Never |
185 | 65.6 |
|
1 - 2 times |
77 | 27.3 |
|
3 - 4 times |
13 | 4.6 |
|
Length of stay in Hospital (Days) |
||
|
2 - 5 days |
230 | 81.6 |
|
6 -10 days |
45 | 16.0 |
|
More than 10 days |
7 | 2.4 |
Expectation from Nursing Service Quality
The total score of patients expectations from nursing service quality was mean = 100.68 and standard deviation (SD) = 8.60 (Table 2). Highest expected dimension from nursing service quality was Reliability and the lowest expected dimension was Responsiveness.
Table 2.Nursing service quality expectation by patients (n = 282)
|
Dimensions of SERVQUAL Scale |
Patients expectation | |
| Mean | SD | |
|
Total expectation score from nursing service quality |
100.68 | 8.60 |
|
Tangibility |
18.67 | 1.67 |
|
Reliability |
23.43 | 2.07 |
|
Responsiveness |
17.02 | 2.55 |
|
Assurance |
19.25 | 2.79 |
|
Empathy |
22.32 | 3.00 |
The mean expectation scores for individual items ranged from highest mean score of 4.96 for “Nurses should be polite” to the lowest mean score of 3.85 for “I expect nurses to tell me exactly when nursing services will be performed” (Table 3).
Table 3. The 5 highest and lowest patient expectation mean scores
|
Aspect of care |
Mean | (SD) |
|
Highest Patient expectation mean scores |
|
|
|
Nurses should be polite |
4.96 | (2.44) |
|
I expect nurses to be well-dressed and to be neat in appearance |
4.84 | (0.42) |
|
Nurses should get adequate support from this hospital to perform their services well |
4.83 | (0.46) |
|
I expect nurses to be sensitive to individual differences among patients |
4.78 | (0.47) |
|
Nurses should maintain my records accurately |
4.77 | (1.34) |
|
Lowest Patient expectation mean scores |
||
|
I expect nurses to tell me exactly when nursing services will be performed |
3.85 | (1.34) |
|
It is okay if nurses are too busy to respond to my requests promptly |
4.02 | (1.11) |
|
I expect nurses to know what my needs are |
4.23 | (0.95) |
|
I expect nurses to offer nursing services at times convenient for me |
4.35 | (0.97) |
|
I expect nurses to give me personal attention when providing services |
4.43 | (0.87) |
Perception of Performance of Nursing Service Quality
The total score for patients perception of performance of nursing service quality was mean = 98.67 and SD = 10.58. The highest scored performance dimension from nursing service quality as perceived by patients was Reliability and the dimension with lowest score was Tangibility (Table 4).
Table 4.Nursing service quality performance as perceived by patients (n = 282)
|
Dimensions of SERVQUAL Scale |
Patients expectation | |
| Mean | SD | |
|
Total expectation score from nursing service quality |
98.67 | 10.58 |
|
Tangibility |
17.66 | 2.22 |
|
Reliability |
22.85 | 2.43 |
|
Responsiveness |
17.81 | 2.46 |
|
Assurance |
18.14 | 2.18 |
|
Empathy |
22.21 | 3.13 |
The mean perception scores for individual items ranged from the highest mean score of 4.73 for “nurses served me with politeness” to the lowest mean score of 4.15 for “nurses told me exactly when nursing services will be performed” (Table 5).
Table 5. The 5 highest and lowest patient perception mean scores
|
Aspect of care |
Mean | (SD) |
|
Highest Patient expectation mean scores |
|
|
|
Nurses served me with politeness |
4.73 | (0.45) |
|
Nurses were always willing to help |
4.65 | (0.59) |
|
When I had problems, nurses were sympathetic and reassuring |
4.64 | (0.61) |
|
nurses are well dressed and neat in appearance |
4.64 | (0.61) |
|
Nurses maintained my records acurately |
4.57 | (0.61) |
|
Lowest Patient expectation mean scores |
||
|
Nurses told me exactly when nursing services will be performed |
4.15 | (0.99) |
|
Nurses shown personal attention when providing services |
4.25 | (0.96) |
|
Nurses provided nursing services using up-todate equipment |
4.27 | (0.79) |
|
Appearance of physical facilities of this ward is in keeping with the type of nursing services being provided |
4.32 | (0.83) |
|
Nurses get adequate support from the hospital to perform their services well |
4.33 | (0.84) |
Nursing Service Quality Gap Score
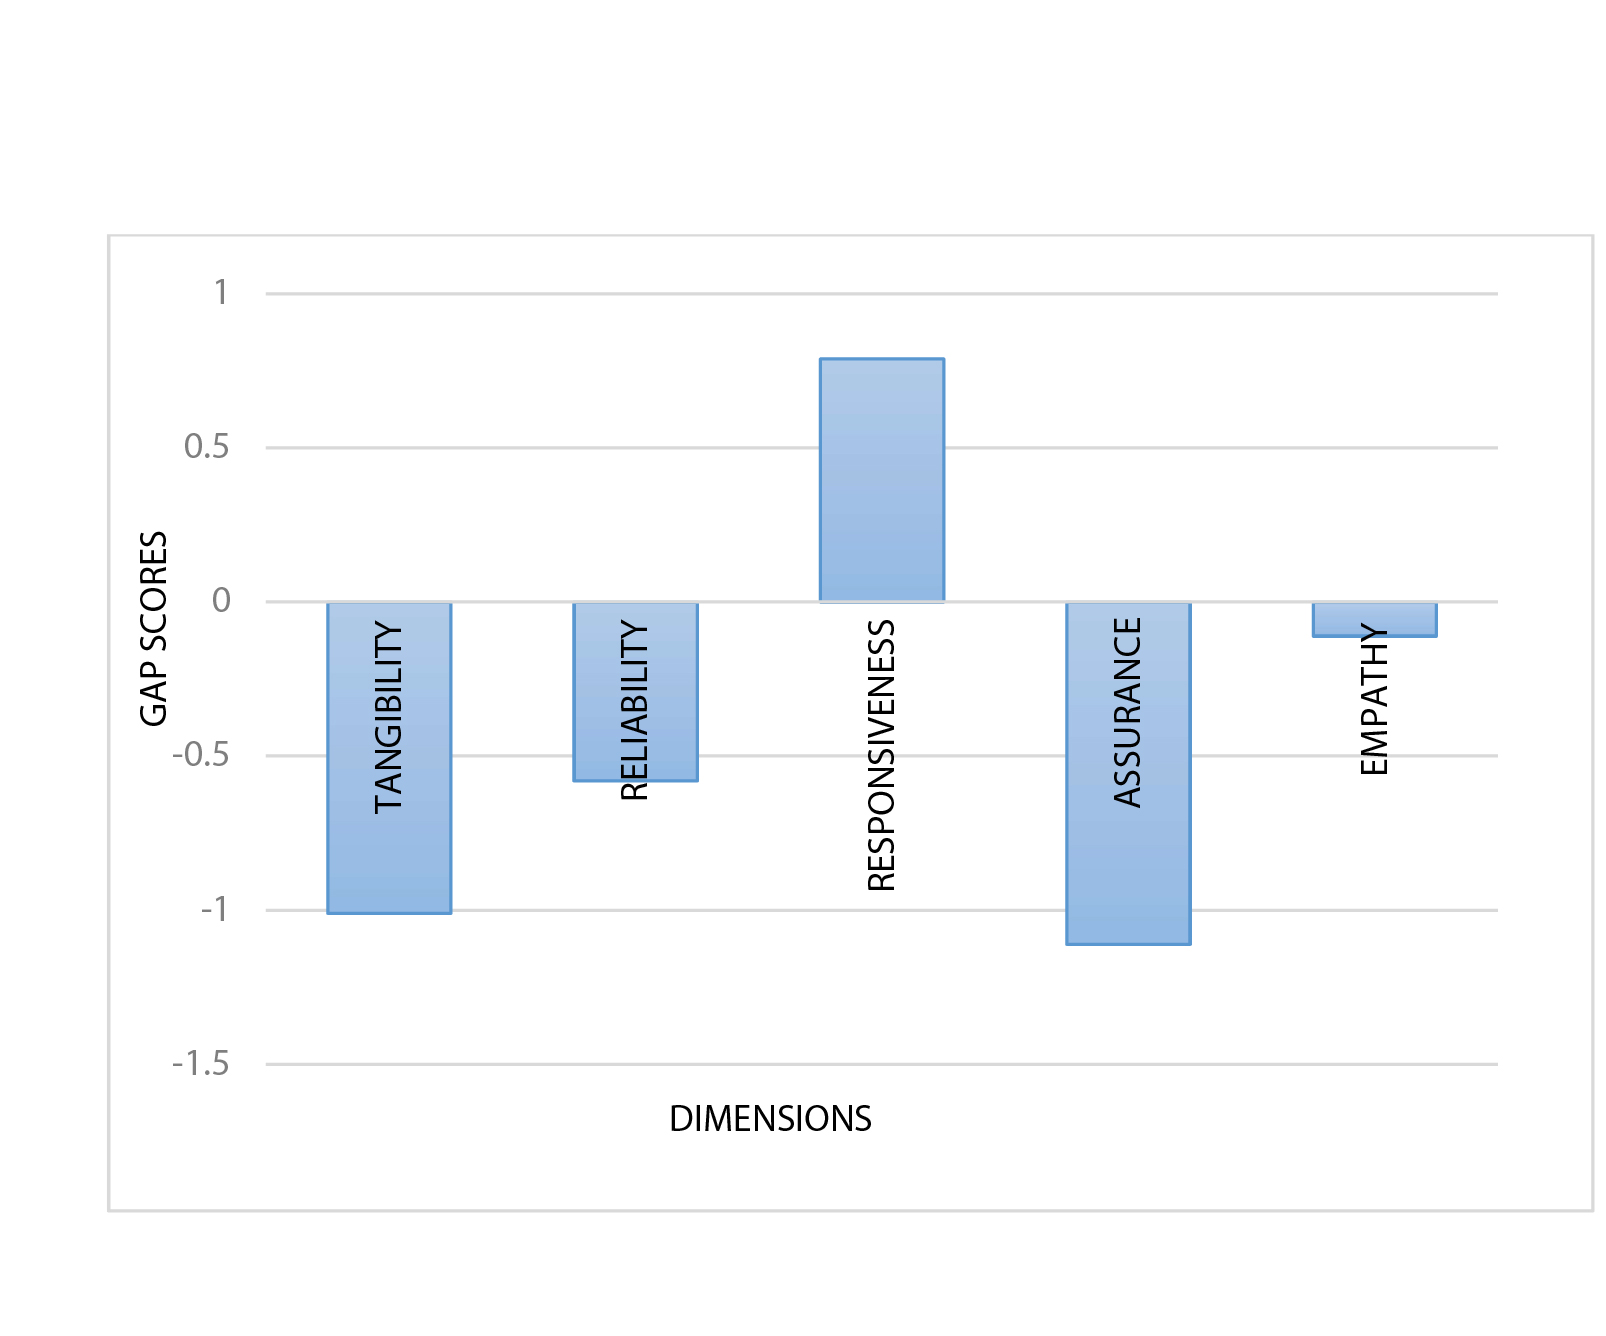
The nursing service quality gap score (i.e. the discrepancy between patients’ expectations and perceptions) was negative SERVQUAL score (-2.01), indicating patients perceived performance of nursing service quality was lower than patients expectations from nursing service quality. Gap score for each dimension of nursing service shown that the 4 dimensions had negative gaps, the largest gap was -1.11 for Assurance, followed by -1.01 for Tangibility, -0.58 for Reliability and-0.11 forEmpathy. In contrast, Responsiveness dimension has shown positive gap 0.79 which indicate patients expectation was met as patients’ perception of nurses’ performance for this dimension was higher than patients’ expectation (Figure 1).
Figure. 1 Gap score for each dimensions of nursing service.
Comments
No comments